Event-time partitioning in Iceberg, and the retrieval filter that refused its own answer
An agent reading a governed warehouse has no equivalent of a human analyst's instinct to double-check a number before repeating it, and that gap is not hypothetical. I built the reference data-and-retrieval architecture end to end on a real public feed and partitioned the lakehouse by each record's own event time rather than by the date it arrived, which is the one choice that lets a governance layer measure how unsettled a count still is. Asked an ordinary question, the retrieval pipeline's filter step used that measurement to drop two of six documents outright and label the rest with how many times each had already changed — including one drop that had been perfectly safe to cite forty-eight hours earlier.
13 min read
Contents
Two days before I wrote this, a note about a timing quirk in a public complaints feed was safe to hand to a model. I had not touched a line of the system since. Asked the same question again this week, it refused — not because the note had become wrong, but because the feed behind it had gone quiet for two days and quietly crossed from a warning into an error. Nothing failed loudly enough for anyone to notice. The system noticed anyway, because I had built it to check.
That is the whole argument of this post, made concrete rather than asserted. Data engineering and context engineering are two of five layers a model-based system needs, and the two claims I made about them there — that an agent cannot tell a column is stale, and that context assembly's job is compress, isolate, trim, filter — had no worked example behind them. So I built one: a governed lakehouse over a real public feed, wired into a hybrid retrieval pipeline, published as a public repository so the numbers below are reproducible rather than quoted.
The feed that makes the point for you
The source is the FTC's public do-not-call complaint data: one file a day, business days only, each row a real complaint about an unwanted call. Every row carries two timestamps — when the call happened, and when the complaint was filed — and the gap between those two clocks is the entire subject of this post.
Ingest and storage are the boring, correct choices: Kafka (I ran Redpanda, which speaks the same protocol and costs nothing to self-host) moving each day's file into an Apache Iceberg table, one row per complaint. The one decision that actually matters is what the table gets partitioned by. Partition by the day a row arrived and you can only ever answer "how many rows did we receive on this date" — a question that looks identical to "how many violations happened on this date" until you check, and on this feed the two diverge on most days. Partition by the violation's own timestamp instead, and the table can answer the question a person actually asked, at the cost that a day's worth of rows now keeps changing for weeks after the day itself has passed.
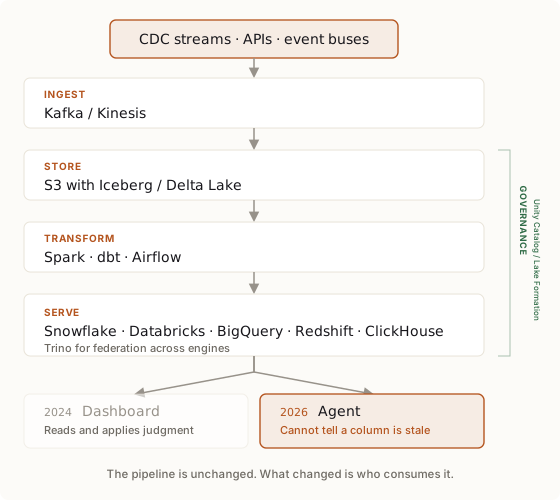
Measured across forty-five days of real deliveries: a single day's file spans a median of 108 distinct violation dates, because complaints about old calls keep arriving mixed in with complaints about yesterday's. Seventy-two percent of the violation dates inside that window received rows from more than one delivery. One date was still receiving new rows across thirty-one separate files.
Here is what that does to one specific number. I replayed the feed one file at a time, landing every delivery as its own snapshot, then read the count for a single violation date at each snapshot in turn:
| As of delivery | Count | Change |
|---|---|---|
| 1 July (first full day) | 6,395 | — |
| 2 July | 7,561 | +1,166 |
| 6 July | 8,186 | +228 |
| … 27 more deliveries … | ||
| 12 August (last delivery held) | 8,975 | +2 |
Every number in that table was correct when it was written. Nothing errored, nothing alerted, no pipeline broke between any two of them. The first full day's answer simply understated the eventual total by twenty-nine percent, and forty-three days after the violation date itself the count was still moving, with no point in that window where it stopped. A person re-running the query notices the number changed and asks why. A system that answered once and kept the answer has no mechanism to notice anything at all.
The defect that looks like corruption and isn't
A second pattern showed up in the same feed, and it is worth walking through because it is more dangerous than the first, precisely because it looks like noise you would clean up rather than a fact you need to keep.
4.45 percent of rows have a violation dated after the complaint that reports it — a call that, according to the data, hadn't happened yet when someone complained about it. Plotted as a distribution rather than dismissed as garbage, the shape gives it away: a median of 2.8 hours, ninety-two percent within six. That is not corruption. It is an unstated timezone. One column records local time where the consumer lives; the other records the reporting system's own timezone; neither column declares which, and nothing in the file format lets you infer it from the value alone. A person glancing at a three-hour discrepancy assumes "ah, local time" without thinking about it. A system reading a column typed as a plain timestamp has no such reflex, and a downstream check built on the assumption of a single clock will compute a result that is wrong by up to six hours without any indication that anything needs checking.
Only twenty-five rows out of 348,293 were genuinely broken rather than merely timezone-confused, and even those split into two distinct failure shapes worth distinguishing rather than lumping together. Four rows carry a violation year that is a single mistyped digit of the real one — 2926, 2226, 2666, 2206 — the kind of fat-finger a human data-entry error produces and a validation rule would catch in a second if anyone had written one. The other twenty-one are subtler: a plausible, ordinary-looking year, but a complaint filed before its own violation by more than a day. Two concrete examples from the same violation date: one complaint was filed a week before the call it describes, the other a full twenty-nine days before. Both are exactly the pair a retrieval system caught later in this post, and neither is a rounding error — they are a record claiming an effect preceded its cause, stated with the same confidence as every correct row around it.
Turning a measurement into a contract
The revision pattern and the timestamp defect are both things a query can compute. What a warehouse does not do on its own is turn that computation into something a consuming system checks before it answers.
I built that layer with dbt, reading the Iceberg tables directly rather than through an export step, using the same contract tooling teams already run against warehouses for correctness reasons, aimed instead at trustworthiness. Every model has an enforced schema, so an upstream change to the feed's structure fails the build the moment it happens rather than surfacing as a wrong answer three systems downstream. A table built specifically to operationalize the revision finding tracks, for every violation date, how many separate deliveries have touched it and — using the measured p95 arrival lag of roughly twelve days as its own threshold, not a guessed one — whether the date is young enough that it is more likely than not still incomplete. dbt's own source-freshness check answers a blunter, equally necessary question: is the table being topped up at all, independent of any single date's history. Its threshold is grounded in the feed's real cadence, one delivery per business day, and it is what escalated from a warning to an error between the last time I checked this system and the moment I sat down to write this paragraph — no code changed in between; two days simply passed without the daily file landing.
Here is the same question, asked the same way, twice — the pattern this whole post argues for, made as literal as I could make it. A tool call returning a number with no context:
{ "violation_date": "2026-06-30", "complaint_count": 8975 }The same number, wrapped in what the contract layer knows about it:
{
  "violation_date": "2026-06-30",
  "complaint_count": 8975,
  "as_of": {
    "revision_count": 32,
    "source_freshness_status": "error"
  },
  "warnings": [
    "this partition has already been revised by 32 separate deliveries since it first appeared",
    "the underlying source is in ERROR on freshness -- today's delivery may not have landed"
  ]
}
Identical number. One version of the response is silent about everything that makes it provisional; the other is not. Nothing about the query changed between them — only whether the system checked its own contract before answering.
Where governance and retrieval turn out to be the same code path
The second claim from the companion piece was that context assembly is retrieval plus four operations on what you assembled: compress it, keep each source attributable, trim it to a budget, and filter out what should not be there. Filter is the operation that does no work in most systems I have seen described, because it needs exactly the contract layer above to have something to check against.
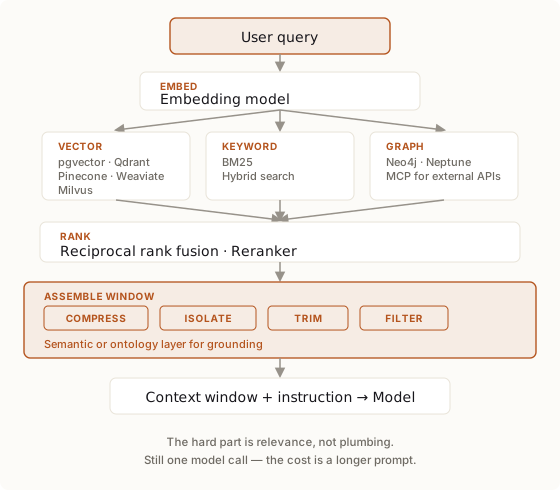
I built the retrieval half against the same data, in Postgres: 721 documents, mostly short generated summaries — one per violation date, one per contracted column, a handful of hand-written notes about the feed's known failure modes — embedded locally with a small open-weights model that costs nothing to run per query, indexed in pgvector alongside Postgres's own keyword index and a small lineage graph, resolved through a recursive query rather than a dedicated graph database, since the lineage here is a handful of tables, not a workload that justifies one. Three independent retrieval passes, merged by reciprocal rank fusion into one ranked list, the same fusion approach used any time you do not want to trust a single retrieval method's ranking as ground truth. Fusion needed one real correction along the way, worth naming as its own small finding: Postgres's default text index splits a date like 2026-06-30 into fragments that a naturally phrased question — "June 30", or even the same date typed differently — often cannot reproduce, so the keyword pass is measurably weak on this corpus's own dates. That is not a reason to drop the keyword pass; it is the actual argument for running three retrieval methods rather than one and letting each cover the others' blind spots, which is exactly what happened here — the semantic pass carried the date-matching weight the keyword pass could not.
Then I asked an ordinary question — whether one specific day's complaint count was settled or still likely to move — and let the fused result run through the filter step twice: once with no contract check at all, once with it turned on. Nothing about the retrieval changed between the two runs.
With no contract check, six documents come back and read as uniformly confident:
[violation summary, 27 June] ...30 deliveries have contributed rows to this date...
[violation summary, 30 July] ...12 deliveries have contributed rows to this date...
[violation summary, 2 April] ...14 deliveries have contributed rows to this date...
[violation summary, 30 July, an unrelated year] ...2 deliveries...
[violation summary, 16 May] ...13 deliveries...
[a governance note about the timezone finding above]
With the contract check turned on, using nothing but what the governance layer already knew, two of those six were dropped outright and four were kept with an explicit warning attached:
[violation summary, 27 June]   -- revised by 30 deliveries
[violation summary, 2 April]   -- revised by 14 deliveries
[violation summary, 30 July, an unrelated year] -- revised by 2 deliveries
[violation summary, 16 May]    -- revised by 13 deliveries

DROPPED -- 30 July: contains rows with a provably impossible violation
  date (a complaint filed before its own violation) -- do not cite
DROPPED -- the timezone governance note: the underlying source has
  itself entered an ERROR state on freshness -- do not cite
Neither drop was staged for this post. The first is the same pair of backwards-causality rows described earlier, surfaced by an unrelated question about a nearby date rather than fetched deliberately. The second drop exists only because two real days passed between an earlier check of this system and the moment I wrote this paragraph, and the freshness contract escalated on its own in between. The retrieval pipeline and the contract layer are, at this point, one mechanism wearing two names.
What this is not a confession of
The keyword weakness above is not a gap I am asking you to overlook — it is guidance: if your corpus has structured-looking text inside natural language (dates, IDs, codes), assume your default text index mangles it and budget for a second retrieval method to compensate, rather than discovering the blind spot in production. The same goes for the twenty-one backwards-causality rows: the fix is not a data-cleaning pass that quietly drops them before anyone sees the pattern, it is a check that keeps producing the pair every time the underlying feed produces another one, because the next one is not guaranteed to look like the last.
The pattern, without the complaints feed
A system that can compute when its own answer might be wrong is a different kind of system from one that merely computes the answer.
Every domain with a "when did we find out" clock running slower than the "when did it happen" clock has this exact shape, whether or not anyone has named it yet:
| Domain | The event clock | The report clock | What silently drifts |
|---|---|---|---|
| Insurance claims | Date of loss | Date filed | Reserve estimates for a loss month, for weeks |
| Clinical adverse events | Onset date | Report date | Signal-detection counts by onset week |
| Retail returns | Purchase date | Return date | Revenue attributed to the sale month |
| Fraud and chargebacks | Transaction date | Dispute date | Loss rate by transaction cohort |
| Manufacturing defects | Production date | Warranty-claim date | Defect rate by production batch |
| Epidemiological case counts | Symptom onset | Case reported | Case counts by onset date, for weeks |
Three choices generalise past any one of these.
Partition storage by the event's own timestamp, not by when your system learned about it. The alternative answers a different, easier-sounding question that happens to look identical on a dashboard until someone checks.
Measure your own arrival-lag distribution before setting a staleness threshold, rather than picking a round number. A twelve-day p95 measured from real deliveries is a defensible contract; a threshold guessed from how the pipeline feels is not, and will either fire constantly or never.
Give the retrieval layer the same contract the warehouse enforces, checked live at the moment of assembly rather than baked into indexed text at build time. A document's words do not change when its subject becomes less certain; only the check does, and it should run every time, not once.
The reference architecture
In build order: Kafka (Redpanda, self-hosted, for ingest at zero licensing cost); Apache Iceberg on object storage, partitioned by event time, for the lakehouse itself; dbt reading that lakehouse directly, with enforced schema contracts and native source-freshness checks, no export step in between; a small compiled table of what every contract currently says, refreshed alongside the transformation layer rather than computed ad hoc; Postgres with pgvector for the vector index, Postgres's own keyword index, and a recursive query over a lineage table, fused by reciprocal rank fusion; a context-assembly step that compresses, isolates, trims, and — reading the compiled contract table live — filters, before anything reaches a model.
The two pieces worth building before you need them, because retrofitting either is expensive: partition your event tables by the event's own timestamp from day one, even if nothing downstream currently cares, because changing a partition key after a table has real history is a rewrite, not a migration; and separate "what the data says" from "how much to trust it right now" into two things a consumer checks independently, because bolting a trust signal onto text already generated means re-indexing every time reality changes underneath it, instead of just re-running one cheap check.
References
Tooling: the public repository for everything measured in this post, runnable end to end at zero cost.
| Source | What it is |
|---|---|
| FTC Do-Not-Call complaint data | U.S. Federal Trade Commission, public domain |
| Bank Marketing dataset | Moro, Rita and Cortez (2014), UCI Machine Learning Repository, CC BY 4.0 — used only to prove the pipeline against a second, independent source, never joined to the complaints data since the two share no real key |
Companion to Data, prompt, context, loop and harness engineering, which sets out the five-layer stack this post supplies the missing worked example for.